
Reclaiming Attention
What thirty days without social media may reveal

The QEEG images and attention-test results discussed here belong to Andrew Feinstein, a Los Angeles documentary filmmaker and founder of Fein Productions. They are not the author’s medical records.
Most people already know that social media can waste time. The more interesting question is harder: can frequent exposure to algorithmic feeds show up in someone’s ability to sustain attention, resist distraction, and respond consistently?
Andrew Feinstein’s public before-and-after case makes that question concrete. After thirty days away from social media, his sustained attention did not merely “feel” better — it measured dramatically better. Brain maps changed too, but the clearest evidence is behavioral.
The case
Feinstein is a documentary filmmaker. In a public video, he shared personal QEEG scans and computerized continuous-performance-test results recorded before and after a month without social media. This essay treats that material as a participant-narrated case study — not a clinical trial, and not peer-reviewed medicine. The measurements still have to stand on method, numbers, timing, and consistency.
His starting point looks like what heavy feed use can feel like from the inside: missing details, rereading the same paragraph, reaching for a phone without deciding to, abandoning slower work, or growing restless when nothing new is happening. On the pre-break attention test, he missed 34 targets and scored 67 on the Accuracy Index — roughly two standard deviations below the age-adjusted average. That does not mean every social-media user would score the same. It does mean compulsive checking and fragmented focus should not be dismissed as mere lack of discipline.
What actually changed
The continuous-performance test is the strongest part of the case because it measures what Feinstein did during a sustained task — not what a color map implies.
| Measure | Before | After | Change |
|---|---|---|---|
| Accuracy Index | 67 | 119 | +52 points |
| Omission errors | 34 | 1 | −33 errors |
| Commission errors | 2 | 1 | −1 error |
| Response time | 377.5 ms | 322.7 ms | 54.8 ms faster |
| Variability | 81.7 ms | 42.3 ms | 39.4 ms lower |
His variability percentile rose from 16 to 92. In plain terms: far fewer missed targets, faster responses, and much more consistency after thirty days offline from social feeds.
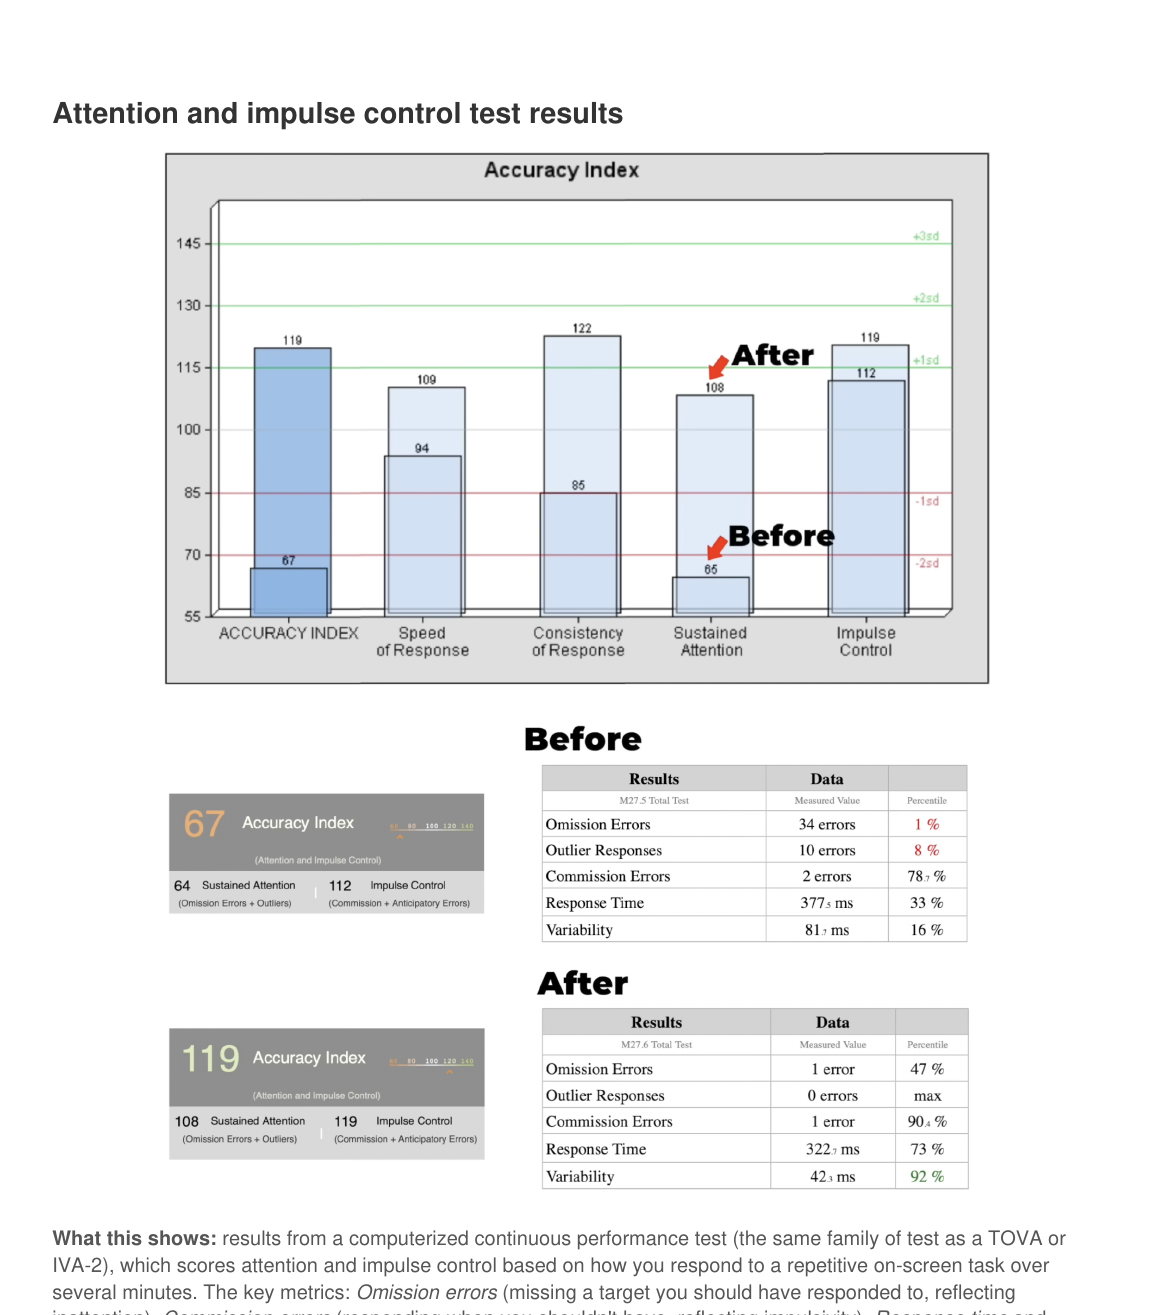
Practice effects can explain part of any retest improvement. Even so, dropping from 34 omissions to 1 is hard to wave away as noise. The result deserves replication under cleaner conditions — alternate test forms, a documented timeline, and as many other variables held steady as possible.
Why feeds train attention this way
Not all screen time is the same. Writing, editing film, reading, and messaging use screens without the same attentional structure as an algorithmic feed. Feeds offer novelty, uncertain rewards, and effortless switching. The issue is less “screens” than environments built to interrupt intention and replace it with the next stimulus.
Reviews of smartphone cognition suggest habitual use can touch attention, memory, and delay of gratification, while also noting that the literature is mixed and causal proof is limited (Wilmer, Sherman, & Chein, 2017). Experiments have also found that the mere presence of a person’s phone can reduce available cognitive capacity on hard tasks, even when the phone stays unused (Ward et al., 2017).
There is no single “social media center” in the brain. Studies of problematic smartphone use point instead to attention-control networks — poorer filtering of distractors and less efficient frontoparietal recruitment (Choi et al., 2021; Kwon et al., 2022). Structural differences reported in heavy social-networking users are associations, not diagnoses (Lee et al., 2019). They do make an attention-focused break biologically plausible.
Platforms also exploit intermittent reward. A notification might be trivial or meaningful; you only find out by checking. That uncertainty trains repeated checking as habit. Useful as that framing is, it should not collapse into the cartoon claim that every ping delivers a harmful “dopamine hit.”
What the brain maps add — and what they don’t
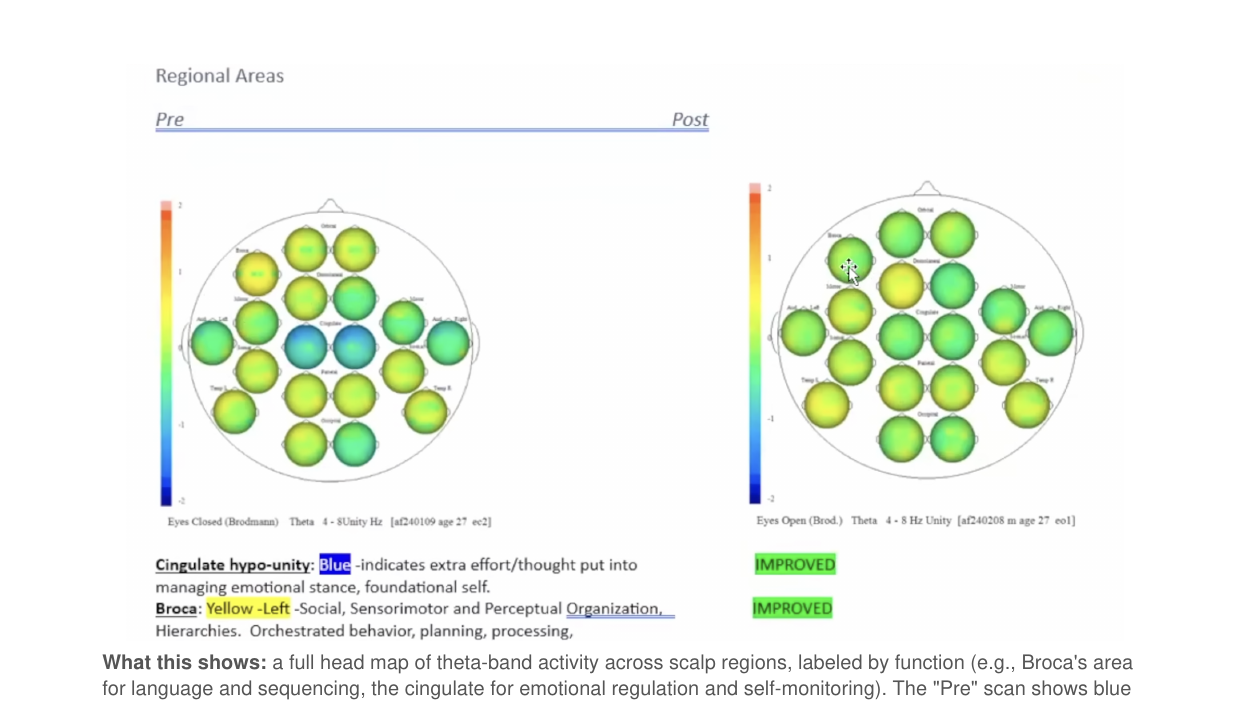
Feinstein’s QEEG displays are supporting observations, not the main proof. Regional theta maps compared pre- and post-break recordings with a normative database. Before, cingulate regions appeared blue and a left Broca-region marker yellow; after, those areas moved closer to the report’s green normative range.
A second display compared spectral power at electrode T7 and a topographic map near 11.47 Hz. After the break, the distribution looked narrower and the left-temporal hotspot less intense.
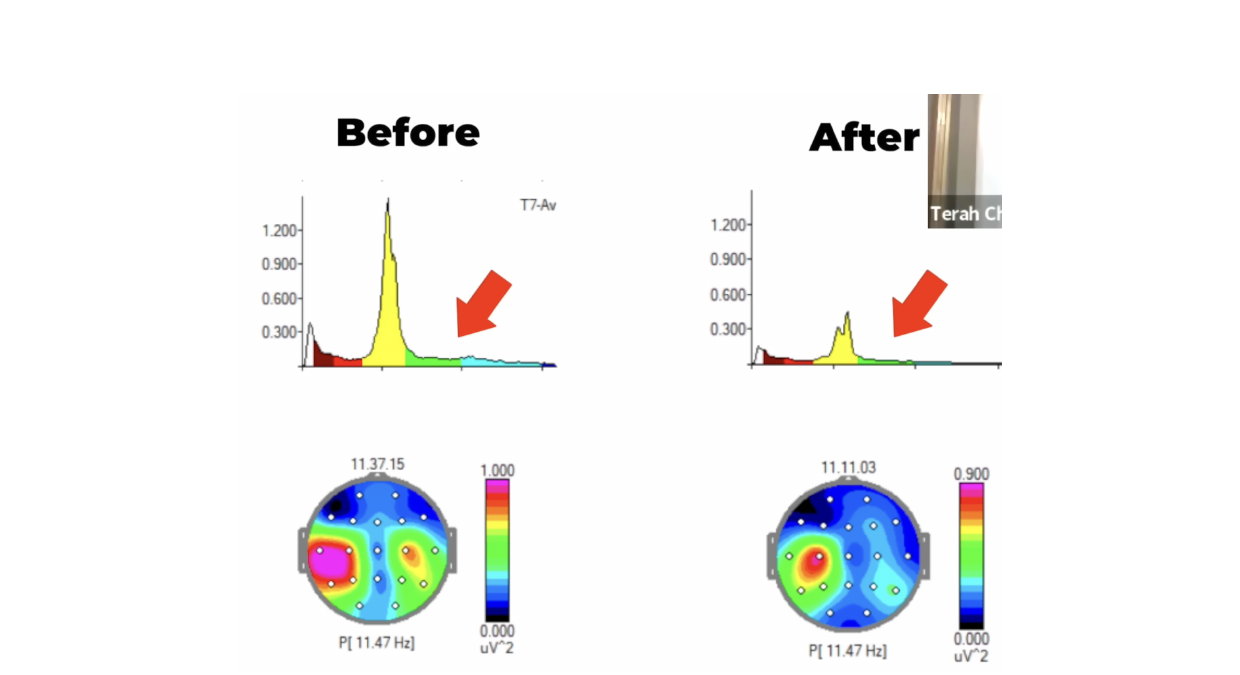
These images are not a test for anxiety, intelligence, emotional health, or “brain damage.” Recording conditions, artifacts, montage, alertness, and the software’s normative database can all move the colors. Their value here is modest and supportive: they changed in the same window as the much clearer behavioral results.
What this means if you feel scattered
A frequent social-media user who feels fragmented may recognize Feinstein’s baseline: missed targets, inconsistent timing, trouble staying with a task. His case cannot predict your score. It can make the hypothesis concrete — that an attention system trained by novelty and interruption may perform worse when asked to stay steady.
Sleep, stress, caffeine, expectancy, exercise, medication, and testing conditions remain possible contributors. Those alternatives weaken strict causation. They do not erase the size of the change. For at least some heavy users, a month without social feeds may reveal how much attentional capacity was being drowned out by constant interruption.
A thirty-day self-test
The useful response is not “use your phone less.” It is a defined experiment:
- For thirty days, remove algorithmic social feeds and their notifications while keeping purposeful digital work.
- Log social-media minutes, phone pickups, sleep, caffeine, and major changes in stress, exercise, medication, or workload.
- Run the same brief sustained-attention task before and after under comparable conditions.
- Optionally reintroduce platforms one at a time afterward to see what holds and what reverses.
That will not recreate a lab trial. It is still better than guessing from mood. The outcome that matters is whether you can stay with a task: fewer misses, less variability, fewer unplanned checks, and more tolerance for reading, conversation, or work that unfolds slowly.
Closing
Feinstein’s case is compelling because it does not stop at the claim that social media is distracting. It shows what severe attentional inconsistency looked like in one person before a thirty-day break — and what changed after.
The clearest result is behavioral: 34 missed targets became 1; Accuracy Index rose from 67 to 119; speed and consistency improved. The QEEG displays changed too, but they should not be used to diagnose anxiety or claim the brain was damaged and repaired.
If you compulsively check feeds, struggle with slower tasks, or feel chronically fragmented, his baseline may feel uncomfortably familiar. His outcome is not a guarantee. It is a strong reason to run the same basic test: remove social media for thirty days, keep other variables as stable as you can, and measure attention before and after.
The important question is no longer whether social media is bad in the abstract. It is how differently a particular mind performs when the feed is gone.
References
- Choi, J., Cho, H., Choi, J. S., Choi, I. Y., Chun, J. W., & Kim, D. J. (2021). The neural basis underlying impaired attentional control in problematic smartphone users. Translational Psychiatry, 11, 129. https://doi.org/10.1038/s41398-021-01246-5
- Feinstein, A. (n.d.). Reclaiming attention: Personal before/after brain scans and attention testing [Video]. YouTube. https://www.youtube.com/watch?v=8h8H9xf0JDY
- Kwon, M., et al. (2022). Neurocognitive mechanisms underlying internet/smartphone addiction: A preliminary fMRI study. Tomography, 8(4), 1782–1797. https://doi.org/10.3390/tomography8040150
- Lee, D., et al. (2019). Lateral orbitofrontal gray matter abnormalities in subjects with problematic smartphone use. Journal of Behavioral Addictions, 8(3), 404–411.
- Ward, A. F., Duke, K., Gneezy, A., & Bos, M. W. (2017). Brain drain: The mere presence of one’s own smartphone reduces available cognitive capacity. Journal of the Association for Consumer Research, 2(2), 140–154. https://doi.org/10.1086/691462
- Wilmer, H. H., Sherman, L. E., & Chein, J. M. (2017). Smartphones and cognition: A review of research exploring the links between mobile technology habits and cognitive functioning. Frontiers in Psychology, 8, 605. https://doi.org/10.3389/fpsyg.2017.00605